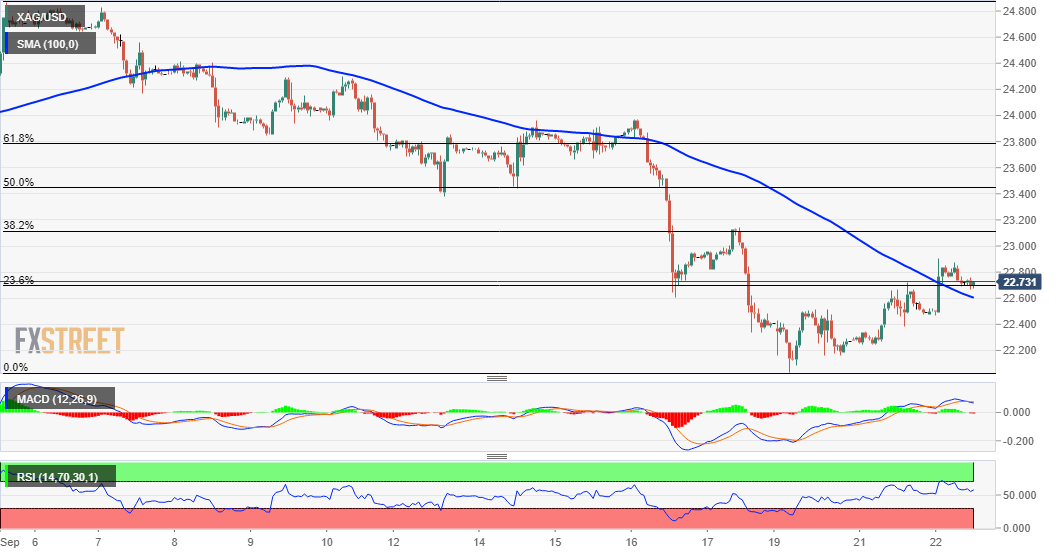
Silver Price Analysis: XAG/USD eases from three-day tops, holds above 100-hour SMA
- Silver gained positive traction for the second consecutive session on Wednesday.
- Sustained move beyond the $22.65-70 confluence paved the way for further gains.
- Bearish oscillators on the daily chart warrant caution for aggressive bullish traders.
Silver gained traction for the second successive day and recovered further from the lowest level since November 2020, around the $22.00 mark touched on Monday. The metal climbed to three-day tops, around the $22.90 region during the first half of the trading action on Wednesday, though lacked bullish conviction.
Looking at the technical picture, the momentum pushed the XAG/USD through the $22.65-70 confluence hurdle, comprising of 100-hour SMA and the 23.6% Fibonacci level of the $24.87-$22.04 recent leg down. However, the intraday pullback from the vicinity of the $23.00 mark warrants caution for aggressive bullish traders.
Meanwhile, technical indicators on the daily chart are holding deep in the negative territory and have been losing positive traction on the 1-hourly chart. The set-up seems tilted in favour of bearish traders, which further makes it prudent to wait for some follow-through buying before positioning for any further gains.
From current levels, the $22.50 area could protect the immediate downside ahead of the overnight swing lows, around the $22.25-20 region. This is followed by the $22.00 round-figure mark (YTD lows), which if broken decisively will be seen as a fresh trigger for bearish traders and turn the XAG/USD vulnerable to slide further.
The next relevant support is pegged near September 2020 lows, around the $21.65 region, before the XAG/USD eventually drops to challenge the $21.00 mark for the first time since July 2020.
On the flip side, momentum beyond the $22.90 area is likely to confront stiff resistance near the 38.2% Fibo. level, around the $23.10 region. A sustained strength beyond might trigger a short-covering move and lift the XAG/USD towards the 50% Fibo., around the $23.45-50 region, en-route the $23.80-85 supply zone (61.8% Fibo.).
Silver 1-hour chart

Technical levels to watch
