Gold Price Forecast: XAU/USD needs to defend critical $1810 support – Confluence Detector
- Gold price keeps pushing lower amid firmer Treasury yields, DXY.
- Gold eyes critical support at $1810 amid souring market mood.
- Gold bulls remain in control following dismal NFP data.
Gold price extends its corrective decline from two-month highs into the second straight day on Tuesday, as investors shrug off the effect of a big US NFP miss amid prospects of an extended period of easy monetary policy. The US dollar benefits from the rally in the Treasury yields, as the reflation trades could be back in play. Higher yields tend to weigh negatively on the non-yielding gold. However, the worsening market mood could help limit the downside in gold price amid a lack of first-tier US economic data.
Read: Gold Price Forecast: XAU/USD's post-NFP move up falters near $1,832-34 hurdle
Gold Price: Key levels to watch
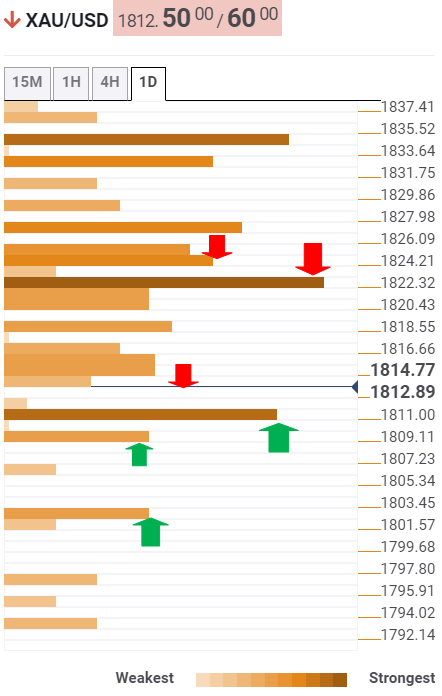
The Technical Confluences Detector shows that gold price is teasing the critical demand area at $1810, which is the intersection of the SMA200 one-day and pivot point one-day S3.
Immediate support is then seen at $1808, where the pivot point one-week S1 aligns.
A sharp drop towards the previous week’s low of $1802 cannot be ruled if the abovementioned support surrenders. At that point, the SMA100 four-hour coincides.
Further south, the SMA50 one-day at $1797 could come to the rescue of gold buyers.
Alternatively, a bunch of healthy resistance levels is stacked up around $1816, the confluence of the pivot point one-day S2, the previous low four-hour and SMA100 one-day.
Gold bulls need to scale the latter to unleashing additional recovery towards the $1821, where the previous day’s low, SMA5 four-hour and Fibonacci 38.2% one-week meet.
The next relevant upside barrier is seen at the Fibonacci 38.2% one-day of $1825. If the upswing gains momentum, then a test of the $1830 round number could be in the offing.
Here is how it looks on the tool
About Technical Confluences Detector
The TCD (Technical Confluences Detector) is a tool to locate and point out those price levels where there is a congestion of indicators, moving averages, Fibonacci levels, Pivot Points, etc. If you are a short-term trader, you will find entry points for counter-trend strategies and hunt a few points at a time. If you are a medium-to-long-term trader, this tool will allow you to know in advance the price levels where a medium-to-long-term trend may stop and rest, where to unwind positions, or where to increase your position size.