USD/CAD Price Analysis: Eases below 1.3100, weekly resistance line in focus
- USD/CAD fades recovery moves from 50% Fibonacci retracement level.
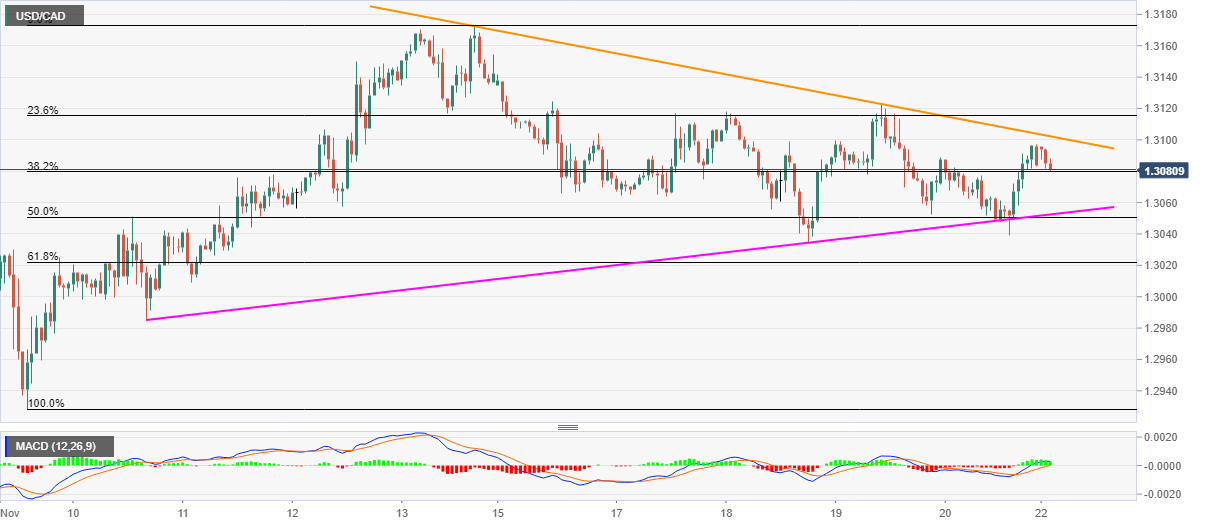
- Bullish MACD, two-week-old support line keep buyers hopeful.
- 61.8% Fibonacci retracement adds to the downside filter.
USD/CAD drops to 1.3081 during Monday’s Asian trading. Even so, the pair keeps its U-turn from 50% Fibonacci retracement of November 09-13 upside amid bullish MACD. Also favoring the buyers is an upward sloping trend line from November 10.
Hence, USD/CAD bulls can look for fresh entries on the upside break of the immediate resistance line, stretched from November 13, at 1.3102 now, while watching over 1.3170/75 as the next hurdle to the north.
If at all the buyers manage to tackle the 1.3175 resistance, the 1.3300 round-figure and the monthly peak of 1.3370 will gain the market’s attention.
On the downside, a clear break below a two-week-old support line, currently around 1.3050, become necessary for the bears before revisiting the 50% of Fibonacci retracement and latest lows around 1.3030.
It should, however, be noted that the USD/CAD sellers’ dominance past-1.3030 can be tested by the 61.8% Fibonacci retracement level of 1.3020 and the 1.3000 psychological magnet before highlighting the monthly bottom close to 1.2930 for the bears.
USD/CAD hourly chart
Trend: Further recovery expected