Back
19 May 2020
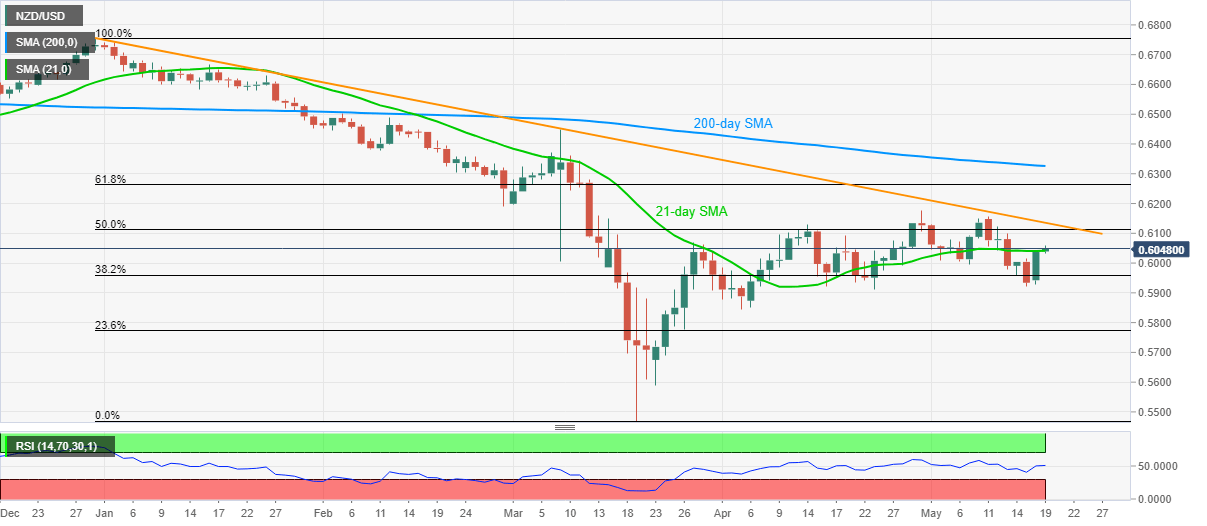
NZD/USD Price Analysis: Prints mild gains above 21-day SMA
- NZD/USD carries the previous day’s recoveries from 0.5927, nears four-day high.
- The yearly resistance line keeps buyers worried.
- Sellers will look for entries below late-April low.
NZD/USD pierces 21-day SMA while taking the bids near 0.6050, up 0.13% on a day, ahead of the European session on Tuesday.
That said, the pair currently escalates the previous day’s recovery moves towards a falling trend line from December 31, 2019, at 0.6135 now.
However, a sustained break above 0.6135 enables the bulls to challenge 61.8% Fibonacci retracement of the pair’s drop from late-2019 to March 2020, near 0.6265.
On the contrary, the bears shouldn’t be looking for entries unless the quote stays above April 23 low of 0.5910. Though, cashing on the pullback moves toward 0.6000 can’t be ruled out.
If at all the NZD/USD prices slip below 0.5910, April month low near 0.5840 may gain the market’s attention.
NZD/USD daily chart
Trend: Bullish