AUD/JPY Technical Analysis: 74.60/50 on seller’s radar
- AUD/JPY reverses from 100-week SMA, two-year-old resistance line.
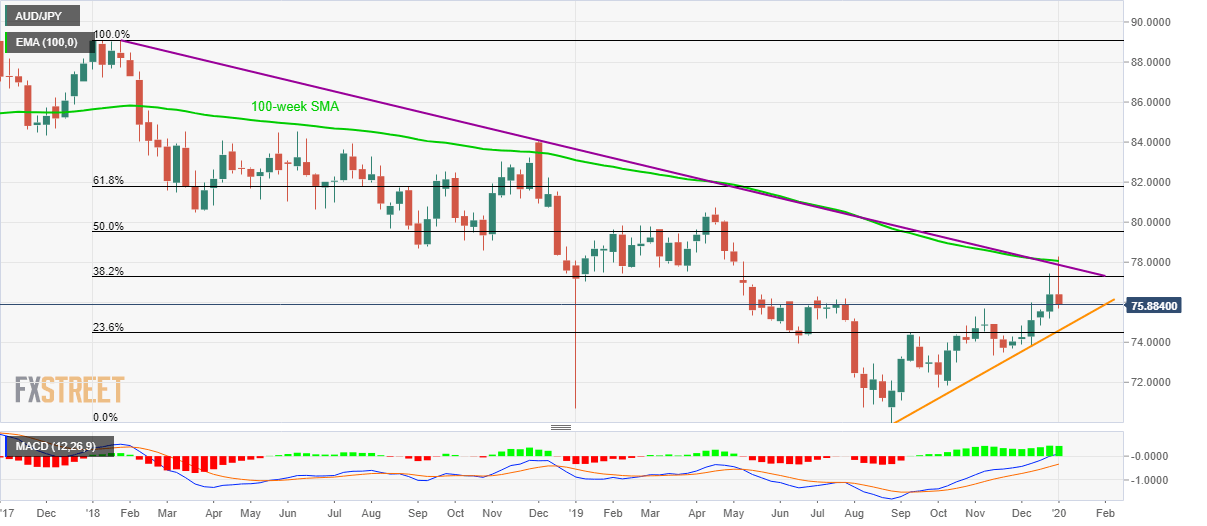
- A four-month-long rising support line, 23.6% Fibonacci retracement could restrict the latest declines.
AUD/JPY stays under pressure while taking rounds to 75.90 during early Friday morning in Asia. The pair recently took a U-turn from a confluence of multi-year-old resistance line and 100-week SMA. That said, sellers are now looking towards an ascending trend line since late-August.
In addition to the four-month-old rising trend line, 23.6% Fibonacci retracement of the year 2018/19 downpour also contributes towards making 74.60/50 as the key support.
It should, however, be noted, that the pair’s declines below 74.50 might not hesitate to visit mid-August top surrounding 73.00 ahead of targeting the previous year's bottom close to 70.00 round-figure.
Alternatively, 38.2% Fibonacci retracement level near 77.30 can act as immediate resistance before pushing the pair back to the aforementioned resistance line, at 77.85 now, followed by a 100-week SMA level of 78.10.
If bullish MACD manages to support the buyers beyond 78.10, April 2019 high near 80.75 will be on their radars.
AUD/JPY weekly chart
Trend: Pullback expected