EUR/USD Technical Analysis: Are Euro bulls really throwing in the towel ?
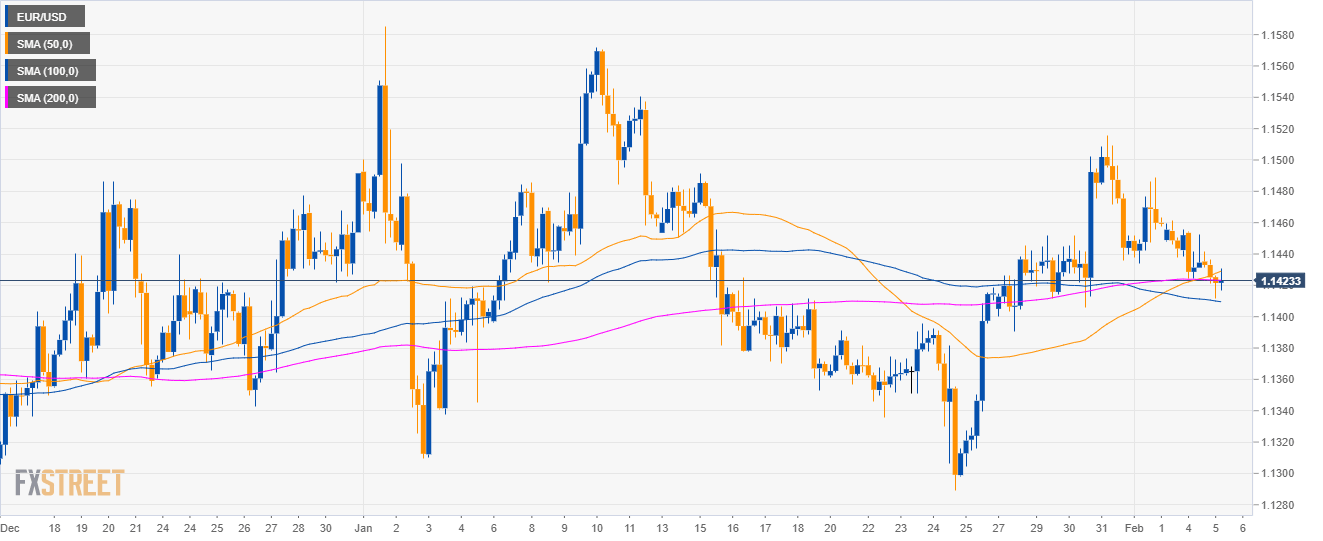
EUR/USD daily chart
- EUR/USD is trading in a bear trend below the 200-day simple moving average (SMA).

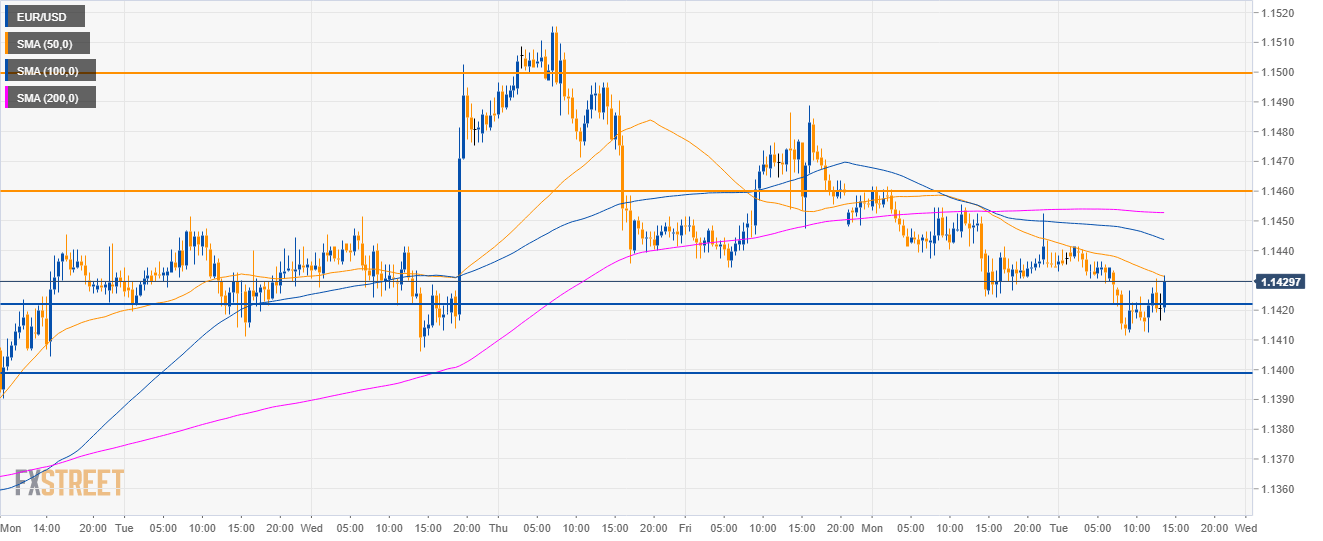
EUR/USD 4-hour chart
- The main SMAs are coiled together suggesting that in the medium-term investors are undecided.
EUR/USD 30-minute chart
- EUR/USD is trading above the 1.1400/20 support in a consolidation day.
- EUR/USD bulls might reach 1.1460 before any meaningful break below 1.1400 figure.
Additional key levels
EUR/USD
Overview:
Today Last Price: 1.1421
Today Daily change: -13 pips
Today Daily change %: -0.11%
Today Daily Open: 1.1434
Trends:
Daily SMA20: 1.1425
Daily SMA50: 1.1398
Daily SMA100: 1.144
Daily SMA200: 1.1557
Levels:
Previous Daily High: 1.1462
Previous Daily Low: 1.1424
Previous Weekly High: 1.1516
Previous Weekly Low: 1.139
Previous Monthly High: 1.1586
Previous Monthly Low: 1.1289
Daily Fibonacci 38.2%: 1.1439
Daily Fibonacci 61.8%: 1.1447
Daily Pivot Point S1: 1.1419
Daily Pivot Point S2: 1.1403
Daily Pivot Point S3: 1.1382
Daily Pivot Point R1: 1.1456
Daily Pivot Point R2: 1.1477
Daily Pivot Point R3: 1.1493