Gold Technical Analysis: Once again fails near 1-week old trading range hurdle
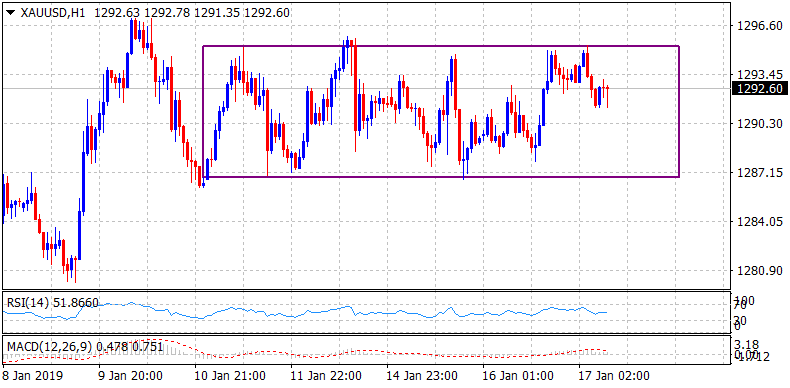
• The precious metal struggled to build on the overnight positive momentum and was again seen retreating from the top end of a near one-week-old trading range.
• The recent price-action constituted towards the formation of a rectangle, usually seen as continuation pattern but sometimes mark significant trend tops/bottoms.
• The fact that bulls have repeatedly failed ahead of the $1300 psychological mark points to increased selling pressure/long-unwinding pressure at higher levels.
• However, bullish technical indicators on hourly/daily charts remain supportive of persistent dip-buying interest at the lower end of the recent trading band.
• Hence, traders are likely to wait for a convincing breakthrough the mentioned range before positioning aggressively for the commodity's next leg of a directional move.
Gold 1-hourly chart
XAU/USD
Overview:
Today Last Price: 1292.61
Today Daily change: -49 pips
Today Daily change %: -0.0379%
Today Daily Open: 1293.1
Trends:
Previous Daily SMA20: 1281.08
Previous Daily SMA50: 1249.37
Previous Daily SMA100: 1231.38
Previous Daily SMA200: 1228.91
Levels:
Previous Daily High: 1295.25
Previous Daily Low: 1276.2
Previous Weekly High: 1297.15
Previous Weekly Low: 1279.35
Previous Monthly High: 1284.7
Previous Monthly Low: 1221.39
Previous Daily Fibonacci 38.2%: 1287.97
Previous Daily Fibonacci 61.8%: 1283.48
Previous Daily Pivot Point S1: 1281.12
Previous Daily Pivot Point S2: 1269.14
Previous Daily Pivot Point S3: 1262.07
Previous Daily Pivot Point R1: 1300.17
Previous Daily Pivot Point R2: 1307.23
Previous Daily Pivot Point R3: 1319.22