USD/JPY Technical Analysis: Bulls struggling near daily lows below 111.00 level
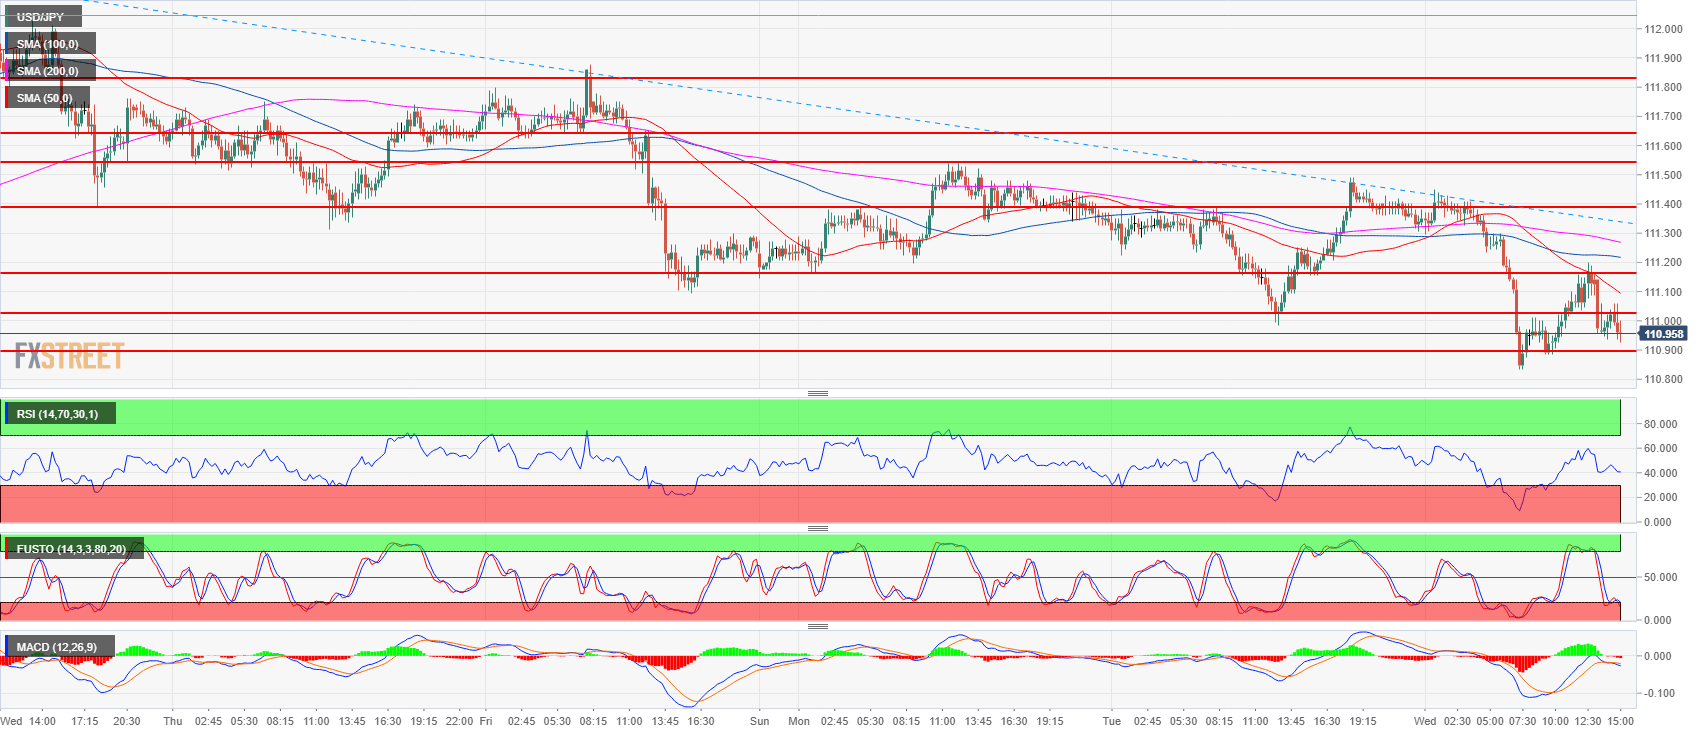
- USD/JPY lost about 50 pips on Wednesday and fell below the 111.00 figure in early European trading.
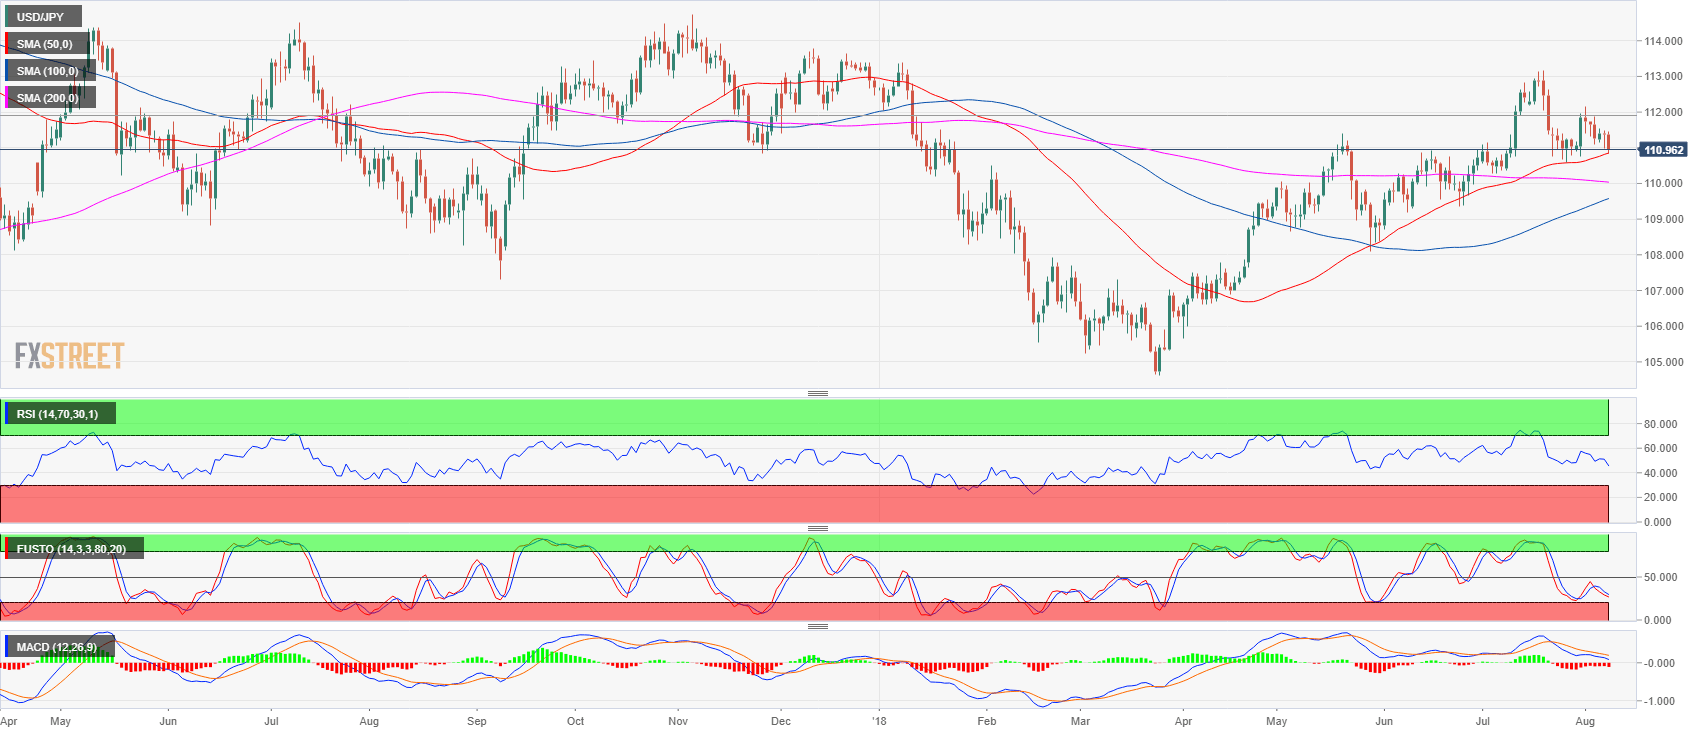
- USD/JPY is trading below its 50, 100 and 200-period simple moving averages suggesting a short-term bearish bias. Bulls objective is to end the bearish pullback phase started on July 19 in order to resume the bullish trend. Ideally, they should be starting making higher highs and would need at least a breakout above 111.54-111.64 area with follow-through buying.
- On the flip side, bears want to convert the current bearish pullback into a bearish reversal. A breakout below 110.58 (July 26 swing low) might force bulls out of their positions and might lead to an acceleration towards 110.27 July 4 low, creating a lower low on the daily chart in the process.
USD/JPY 15-minute chart

USD/JPY daily chart

Spot rate: 110.97
Relative change: -0.38%
High: 111.45
Low: 110.83
Trend: Bullish / Bearish correction above 110.58 July 26 swing low
Resistance 1: 111.02-111.16 area, figure and current August 6 low
Resistance 2: 111.39 May 21 swing high
Resistance 3: 111.54-111.64 area, August 6, high and supply/demand level
Resistance 4: 111.82-112.00 area, supply level and figure
Resistance 5: 112.19-112.40 area, July 11 high and intraday swing low
Resistance 6: 112.64 July 12 high
Resistance 7: 113.18, 2018 high
Resistance 8: 113.26-113.38, 200-weekly simple moving average and January 8 high
Resistance 9: 114.45 October 27, 2017 high
Support 1: 110.90 June 15 swing high
Support 2: 110.75, July 23 low
Support 3: 110.58 July 26 swing low
Support 4: 110.27 July 4 low
