Back
22 Jun 2018
USD/JPY Technical Analysis: forming a symmetrical triangle on hourly charts
• The pair has been oscillating between two converging trend-lines, forming a symmetrical triangle on the 1-hourly chart.
• Currently placed at 100-hour SMA pivot-point, subsequent up-move could get extended back towards the triangle resistance.
• Alternatively, a rejection slide would increase the pair's vulnerability to head back towards retesting a two-week-old ascending trend-line support.
USD/JPY 1-hourly chart
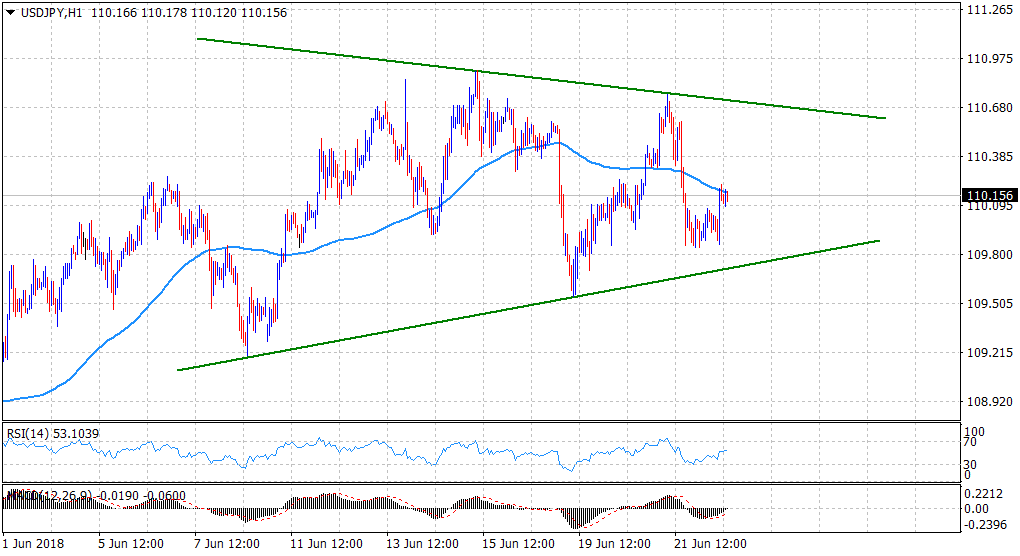
Spot Rate: 110.16
Daily Low: 109.84
Daily High: 110.22
Trend: Range-bound
Resistance
R1: 110.56 (R1 daily pivot-point)
R2: 110.76 (overnight swing high)
R3: 111.00 (round figure mark)
Support
S1: 110.00 (psychological round figure mark)
S2: 109.43 (50-day SMA)
S3: 109.20 (June 8 swing low)