AUD/JPY Price Forecast: Edges higher in a multi-week-old range, up a little above mid-94.00s
- AUD/JPY struggles to capitalize on modest Asian session uptick to over a one-month high.
- The softer Tokyo CPI undermines the JPY and supports the cross amid a positive risk tone.
- The bullish technical setup supports prospects for a breakout through a short-term range.
The AUD/JPY cross trims a part of modest Asian session gains to the 94.85 region, or the highest level since May 14, though it retains the positive bias amid mixed cues. Spot prices currently trade around the 94.60 area, up less than 0.10% for the day.
The Japanese Yen (JPY) remains on the back foot in the wake of a softer Tokyo CPI print, which reaffirmed expectations that the Bank of Japan (BoJ) will forgo raising interest rates this year. Apart from this, the upbeat market mood is seen undermining the JPY's safe-haven status and benefiting the risk-sensitive Aussie, lending some support to the AUD/JPY cross.
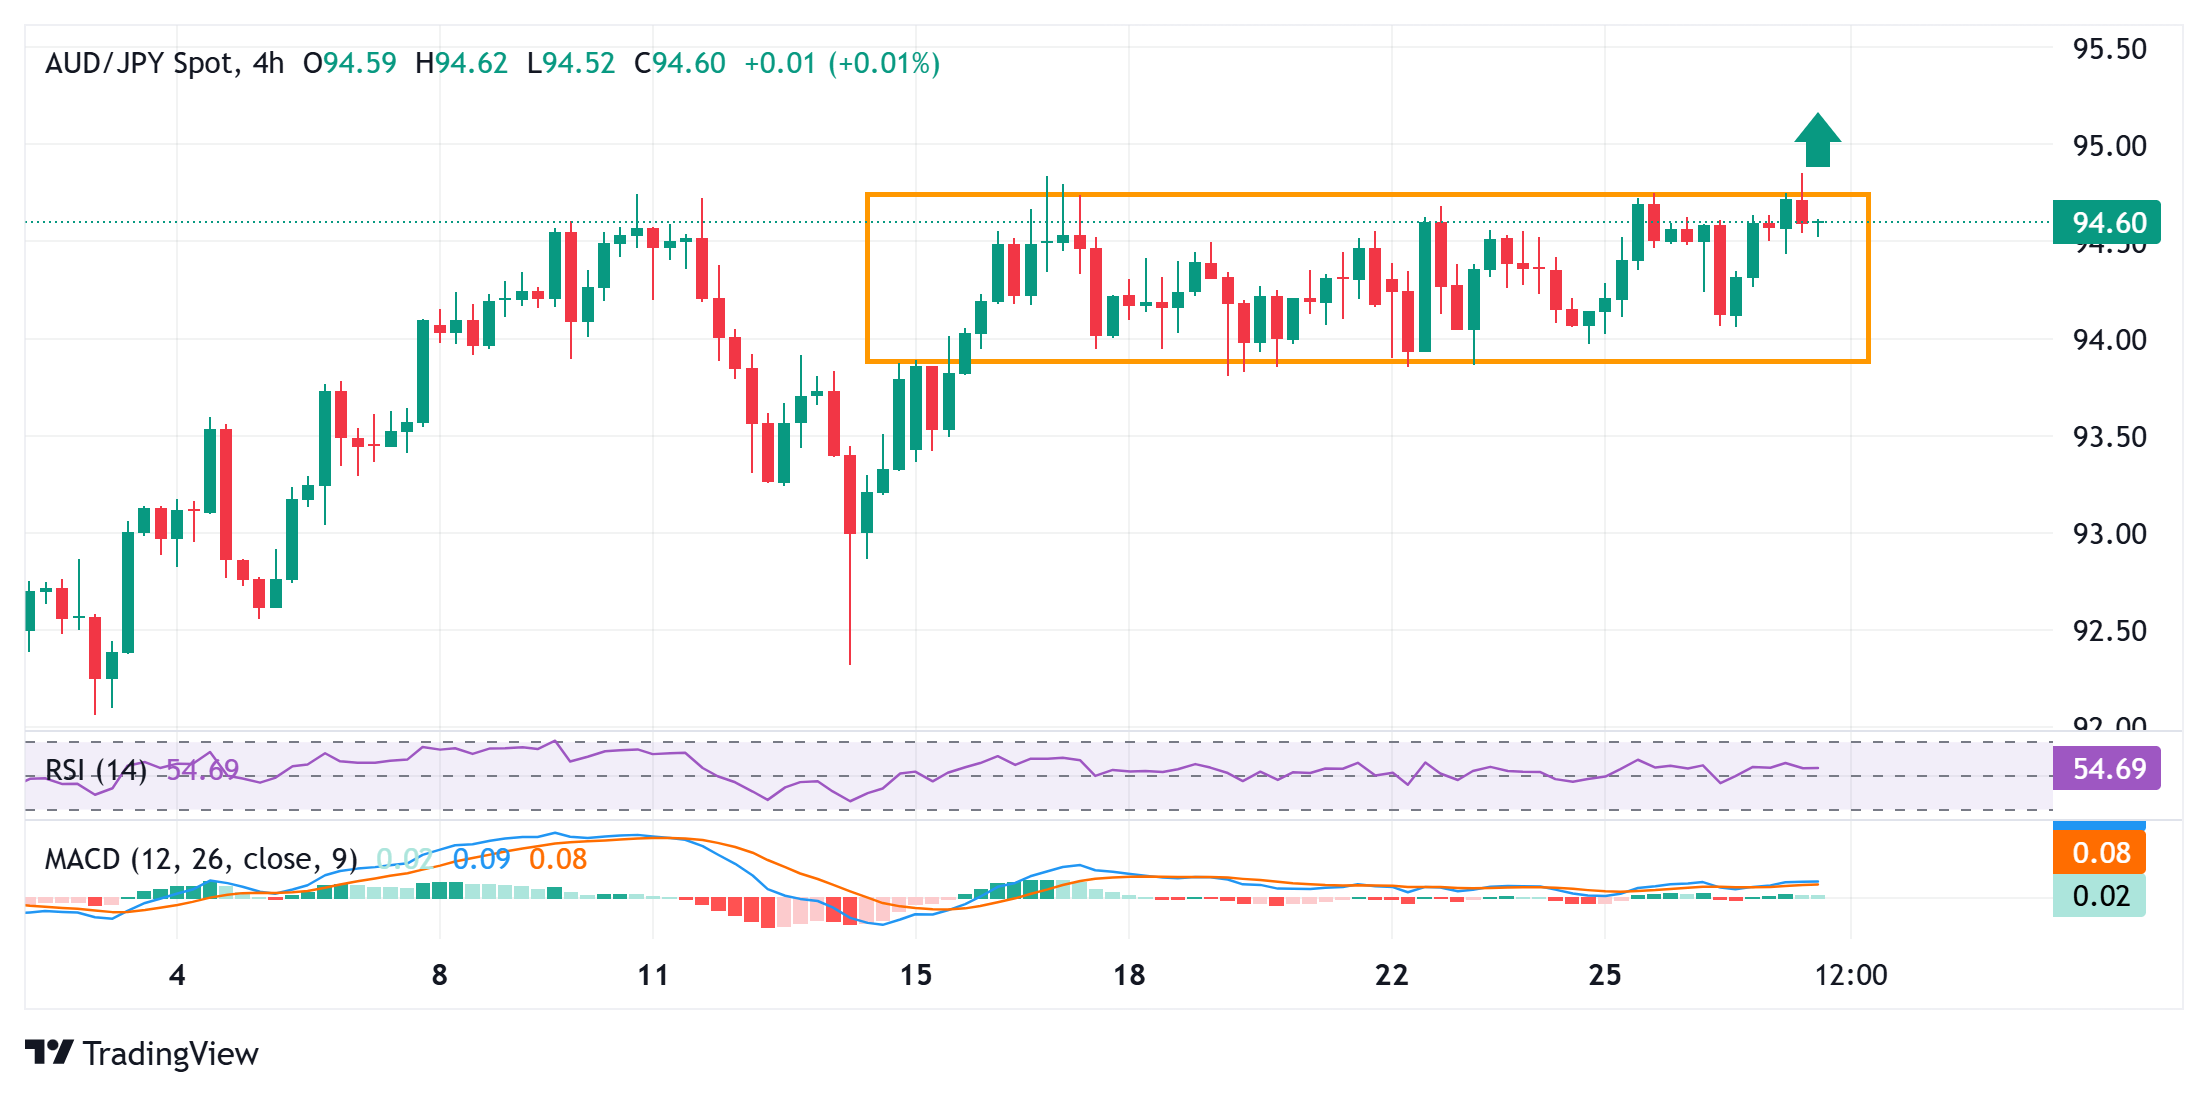
From a technical perspective, the range-bound price action witnessed over the past two weeks or so constitutes the formation of a rectangle chart pattern. This might still be categorized as a bullish consolidation phase amid still positive oscillators on the daily chart and suggests that the path of least resistance for the AUD/JPY cross remains to the upside.
However, it will still be prudent to wait for some follow-through buying beyond the 94.80-94.85 supply zone before positioning for any further gains. The subsequent strength above the 95.00 psychological mark could lift the AUD/JPY cross further and pave the way for a move towards testing the May monthly swing high, around the 95.55 region.
Meanwhile, any corrective pullback could be seen as a buying opportunity near the lower boundary of the trading range, around the 94.00-93.95 region. A convincing break below, however, would negate the constructive outlook and prompt some selling, which, in turn, could drag the AUD/JPY cross to the 93.30 support en route to the 93.00 round figure.
AUD/JPY 4-hour chart
Japanese Yen PRICE Today
The table below shows the percentage change of Japanese Yen (JPY) against listed major currencies today. Japanese Yen was the strongest against the Swiss Franc.
| USD | EUR | GBP | JPY | CAD | AUD | NZD | CHF | |
|---|---|---|---|---|---|---|---|---|
| USD | 0.07% | 0.04% | 0.13% | 0.04% | 0.07% | 0.04% | 0.15% | |
| EUR | -0.07% | -0.08% | 0.03% | -0.05% | -0.03% | -0.17% | 0.02% | |
| GBP | -0.04% | 0.08% | 0.14% | 0.00% | 0.04% | -0.04% | 0.19% | |
| JPY | -0.13% | -0.03% | -0.14% | -0.09% | -0.07% | -0.26% | 0.09% | |
| CAD | -0.04% | 0.05% | -0.00% | 0.09% | 0.06% | -0.12% | 0.15% | |
| AUD | -0.07% | 0.03% | -0.04% | 0.07% | -0.06% | -0.13% | 0.13% | |
| NZD | -0.04% | 0.17% | 0.04% | 0.26% | 0.12% | 0.13% | 0.27% | |
| CHF | -0.15% | -0.02% | -0.19% | -0.09% | -0.15% | -0.13% | -0.27% |
The heat map shows percentage changes of major currencies against each other. The base currency is picked from the left column, while the quote currency is picked from the top row. For example, if you pick the Japanese Yen from the left column and move along the horizontal line to the US Dollar, the percentage change displayed in the box will represent JPY (base)/USD (quote).